
According to the study “Email Marketing & User Experience” conducted by Experian Marketing Services*,
B2B Marketing still has little way to go to improve emailing campaigns performances.
This study results- available here (in french– give us a benchmark by sector together with axes of improvement to boost our campaigns emailing performances:
- E-mail addresses database quality,
- Reactivity to ISP’s anti-spam systems permanent adjustments,
- Responsible use,
- Compliance with the Opt in / Opt out legislation governing the sending of unsolicited communications. In this regard, the study reminds us that B2B actors do not have to collect prior consent to send electronic communications to prospects.
- Segmentation and customization,
- Creating appealing content, and matching promise and content,
- Flat design, image, use of animated GIFs and improved reading comfort,
And as always, do not forget to set a clear objective for each campaign (either downloads, a number of views for a page in the news, the purchase of a product …) and analyze the results. A simple reporting will allow you to follow the evolution of your performances per campaign over time.
Benchmark results and B2B positionning
Marketing emails indicators : NPAI =Undelivery rate , Ouvertures = Open rate , Ouvreurs = Openers, Clics : CTR, Cliqueurs = Clickers, Reactivité =Reactivity Désabonnés = Unsubscribed
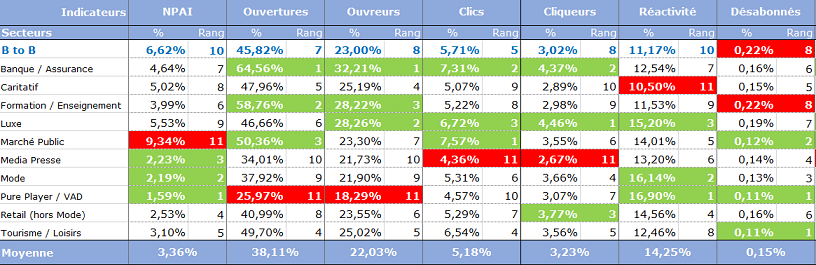
Worst delivery rate after the Public Market sector.
The deliverability of an emailing campaign represents its ability to arrive in the inbox of the recipient and depends on the reputation given to the sender. With a 6.62% of message not delivered in France, the B2B sector is in penultimate position.
France has worst delivery rate of the study and “a 5% of emails non delivered is often given as a benchmark to consider that a database is good”.
Not doing good on average clickers and click rates
While the Public Sector has a click rate of 7.57%, B2B is only 5.71%, and a clickers-rate of 3.02%.
Marketing automation and A / B testing can be good ways to improve these indicators which are highly dependant on brand interest, and sending interesting content marketing.
A reactivity rate of B2B campaigns to reconsider
The reactivity rate of an emailing campaign is to determine the number of people who clicked in the message among the people who opened the message. With a rate of 11.17%, the B2B generates a rate of reactivity which places it again in the penultimate position.
The call to action must be clear and immediately identifiable. Positioned with the key message at the beginning of email, where it is most likely to be seen, it will improve the performance of your campaign.
High unsubscribe rate ex aequo with the education / training sector
B2B gets the last place in the ranking with a rate of 0.22% in France, while the average for all sectors is 0.04% in Spain, proving that there is a strong growth trend.
Tracking unsubscribes help you understand how your recipients perceive your emails. Thus, it is considered that beyond 2%, panic on board !
It is a no brainer to mention that we should avoid the following bad practices
- Vague email object,
- Email without previous opt,
- Unidentified mark,
- Tone of the email too familiar,
- Excessive or inversely too random use of email,
- Email “non responsive” on mobile,
- Email too complicated, too sophisticated, offering too much information, … so many reasons to unsubscribe.
In conclusion, to improve the user experience, no longer decide how many emails you are able to send, but rather analyze how many emails your customers and prospects are willing to receive.

*In France, Germany and Spain.