It’s a no brainer that data vizualization can help you see the wood for the trees, and easily visualize patterns and trends in complex data to help you take the right decisions.
When it comes to SEO, your goal is to generate quality traffic to convert visitors into customers. What else ? If you’re not ranked first or second, some of your competitors definitely are.
So how do you decide which kpis and how many keywords to track ?
Assuming you have already chosen your keywords, the next step is to decide which ones you want to start tracking and which KPI’s are important to start with.
If you are not there yet, there are fantastic articles on the web to understand how to chose your keywords which will also mention which tools can help.
One of my favorite is this one « How to rank for a keyword in 10 steps » by Elisa Gabbert who will take you through 10 steps, until the last one which is called « Analyse » and which is the topic of today’s post.
Remember checking your keywords difficulty is part of the selection process, and refer to this fantastic article from Ankit Singla, Founder, BloggerTipsTricks.
And finally, for a bit of fun, check out this post « 25 keyword research problems that only marketers understand » by Samanta Winchell.
So, now that you selected your keywords to consider, which ones should you be tracking and focusing on ?
It will depend on the size of your company, the size of your website, your ressources-bandwith and your marketing budget, but tracking only 1 or 2 keywords is clearly not an option : your activity can not be summed up in 2 words and you will hardly attract enough visitors with only 2.
On the otherside, can you manage 100 keywords ? Can you take a serious look at them everymonth, stay focus, understand the challenges for each of them, and take the good decisions… probably not.
So if you are a young and small company, with a recent website and not so many pages and content yet, 5 to 10 keywords is probably good to start with. Then you see how it goes add just a few more the next year. Be flexible and agile as Google says over 16% of the queries every day are new queries !
If you are in a large company, your SEO agency will do the work for you but to make it short, you probably have different brands, product categories, web pages (and weither it is a homepage, a blog page or a landing page, you many have a different approach and not target the same keyword through the site) and extra reasons to be more granular. Not talking about segmentation per country and languages for instance…
Now, considering you are not a large company and want to start looking at your SEO activity, let’s look at what your first monthly SEO dashboard may look like.
1. Organic traffic vs direct traffic and referral traffic.
Organic traffic is what most marketers strive to increase. This traffic is defined as visitors coming from a search engine, such as Google or Yahoo. It will tell you how many sessions via organic search you had after the user searched for this keyword.
Direct traffic is one of the most common sources of visits to your website, and is defined as visits with no referring website. To keep this data clean, make sure to filter out your internal IP adresses (yours and your employees)
Refferal traffic look at visitors following a link from one website to your website and the site of origin is considered the referrer. To keep this data clean, make sure to segment out spam refferals. That can make a real difference!
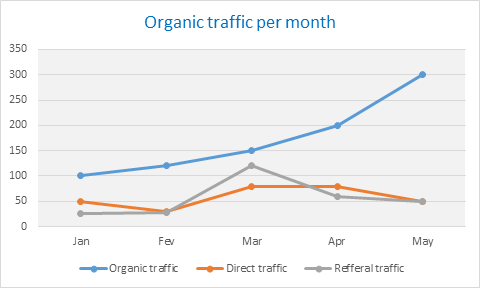
If you see an increase on certain days or months, it’s worth checking what caused it. If your last publication caused a traffic peak, you may want to publish more on the same topic. Is it due to your pay per click campaign, should you extend it, or create a new one ?
On the other side, if you see your referal and direct traffic increase while your Organic traffic decrease, you may consider a change in your SEO strategy. Your last Pay per clic campaign may not be appropriate or your keywords are not relevant…
There is always a stroy behing the numbers, let’s find out what it is !
2. Keywords positionning (or keyword ranking)
This indicator will tell you where your website ranks for a particular search term in the search engines’ results pages.
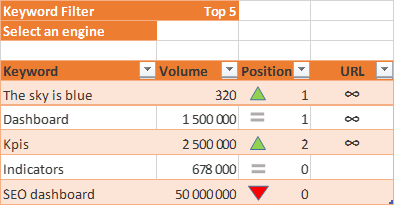
Volume indicates the number of queries for this keyword and it’s potential competitiveness, and Position indicates in which results pages your website is. The URL icon for a direct access of the page is showing on the right.
You may ask yourself if « The sky is blue » is relevant to your business and will drive revenue ? f not, what’s the point ranking in position 1 for a keyword no one cares about but you – unless it drives revenues (see below). On the other side, you may want to put some efforts in driving visitors to your website with « SEO dashboards » ..
Thanks to an interactive dahsboards (such as the ones I create with Tableau Software 🙂 ) you can compare the data per country, language, month, quarter and give you all the details you want if you need to go into more granularity.
Ranking is not everything, think conversion !
3. Keyword conversion
Considering you have already created your website objectives/goals (if not, more details here), a good way to measure your SEO performance is to track corellation between your organic traffic and your goal completion/conversion
Let’s imagine one of your keyword generates a high goal conversion, but is only in Position 5 in Google, then you know there is a fantastic potential waiting for you if rank in Position 1.
In an ideal world of analytics there will be no tables and mountain of text, just charts and graphs, but in few cases, tables offer the best presentation.
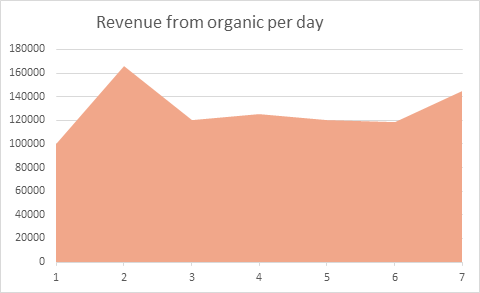
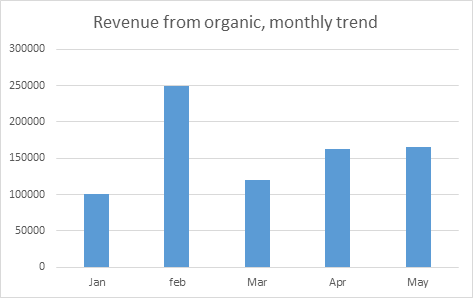
4. Organic revenue
If you are doing e-commerce, or if your web site is linked to a Marketing automation system, and if are able to track your goal completion then you will be able to track your revenu from Organic traffic:
I think you are ready now to start looking at your SEO performance!
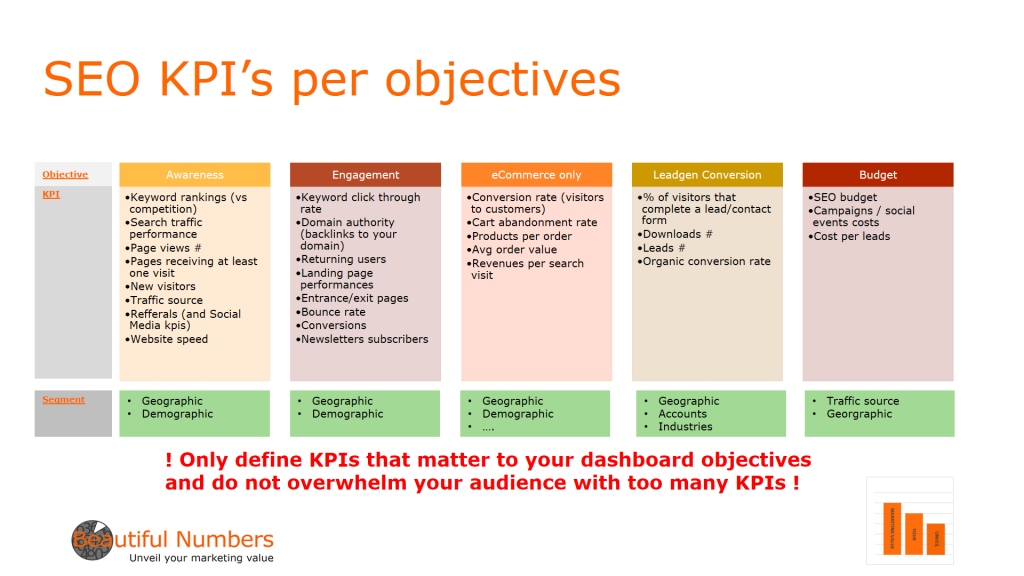
There are many more indicators you may consider depending on the 5 following objectives, if you want to move forward with your 1st dashboard :
- Awareness
- Engagemement
- Ecommerce onl
- Leadgen conversion
- And never forget to add some budget kpis if you are spending money on Organic traffic.
I’ve listed them in the document below but it’s quite difficult to read in a post, so if you want to read the full document, either send me a note @ contact@beautifulnumbers.fr or go to our website and simply ask for it in the contact pages.